DS Week 5
Data Science for Social Science Research
Ashoka University
Gapmidner Replication
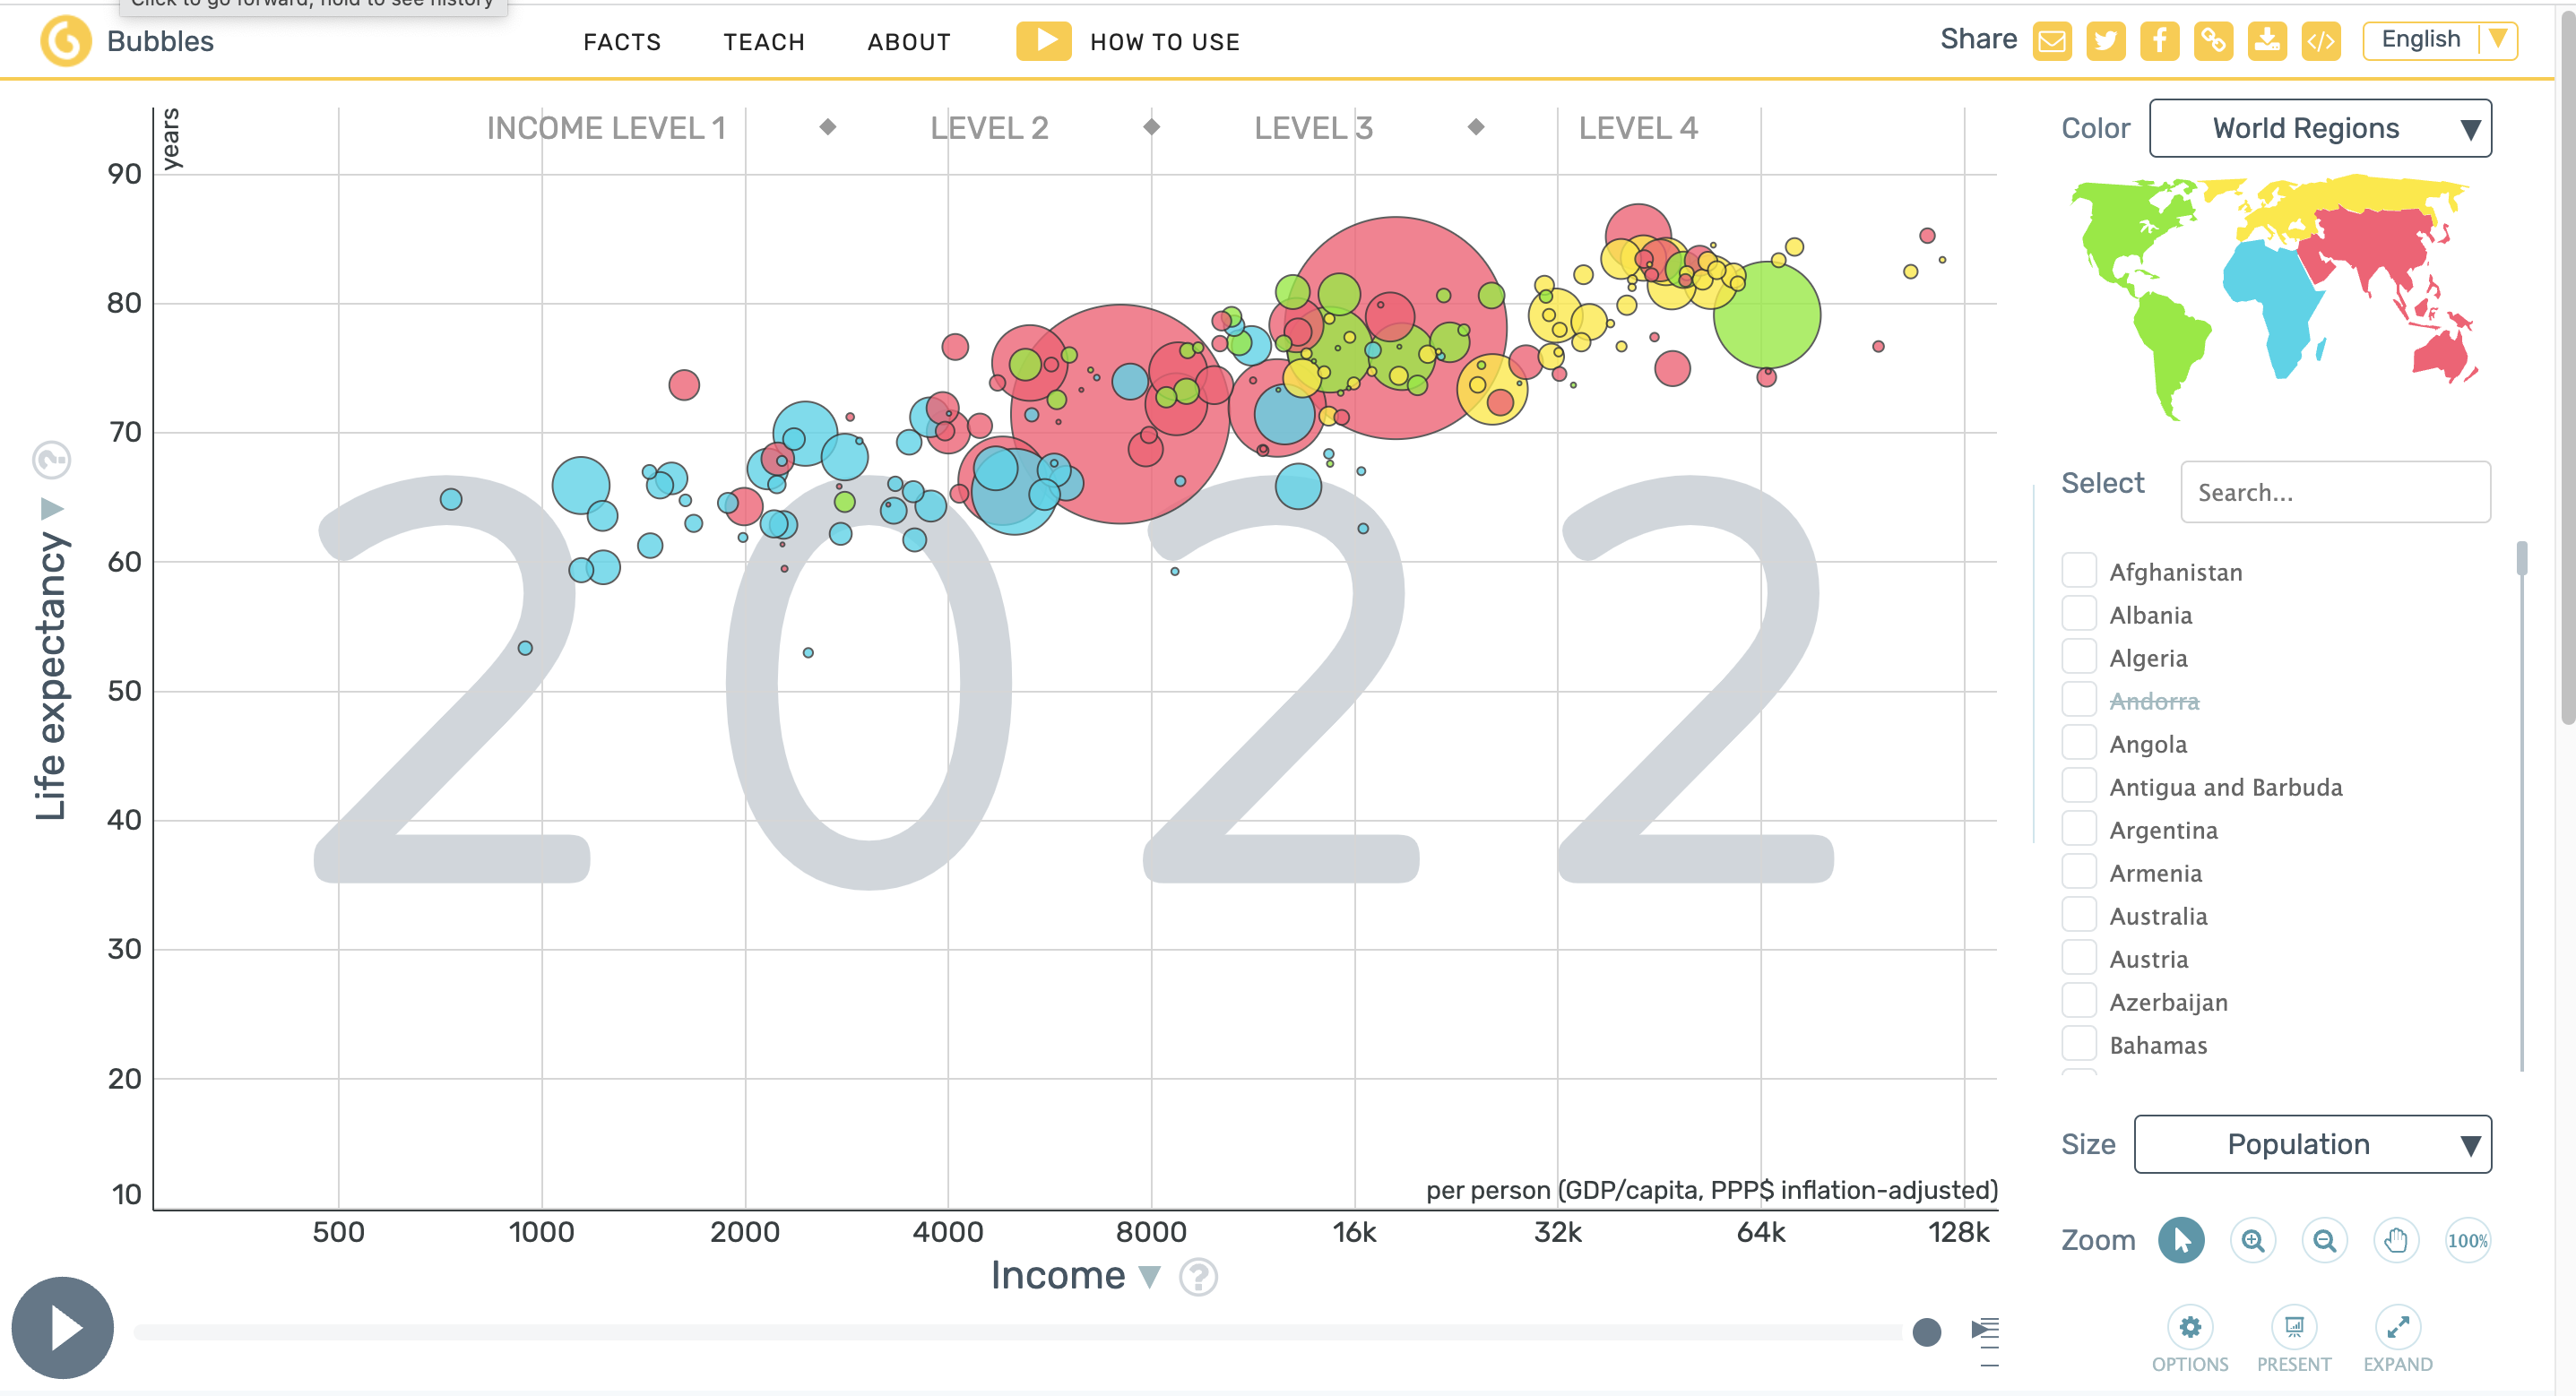
ggplot Visual

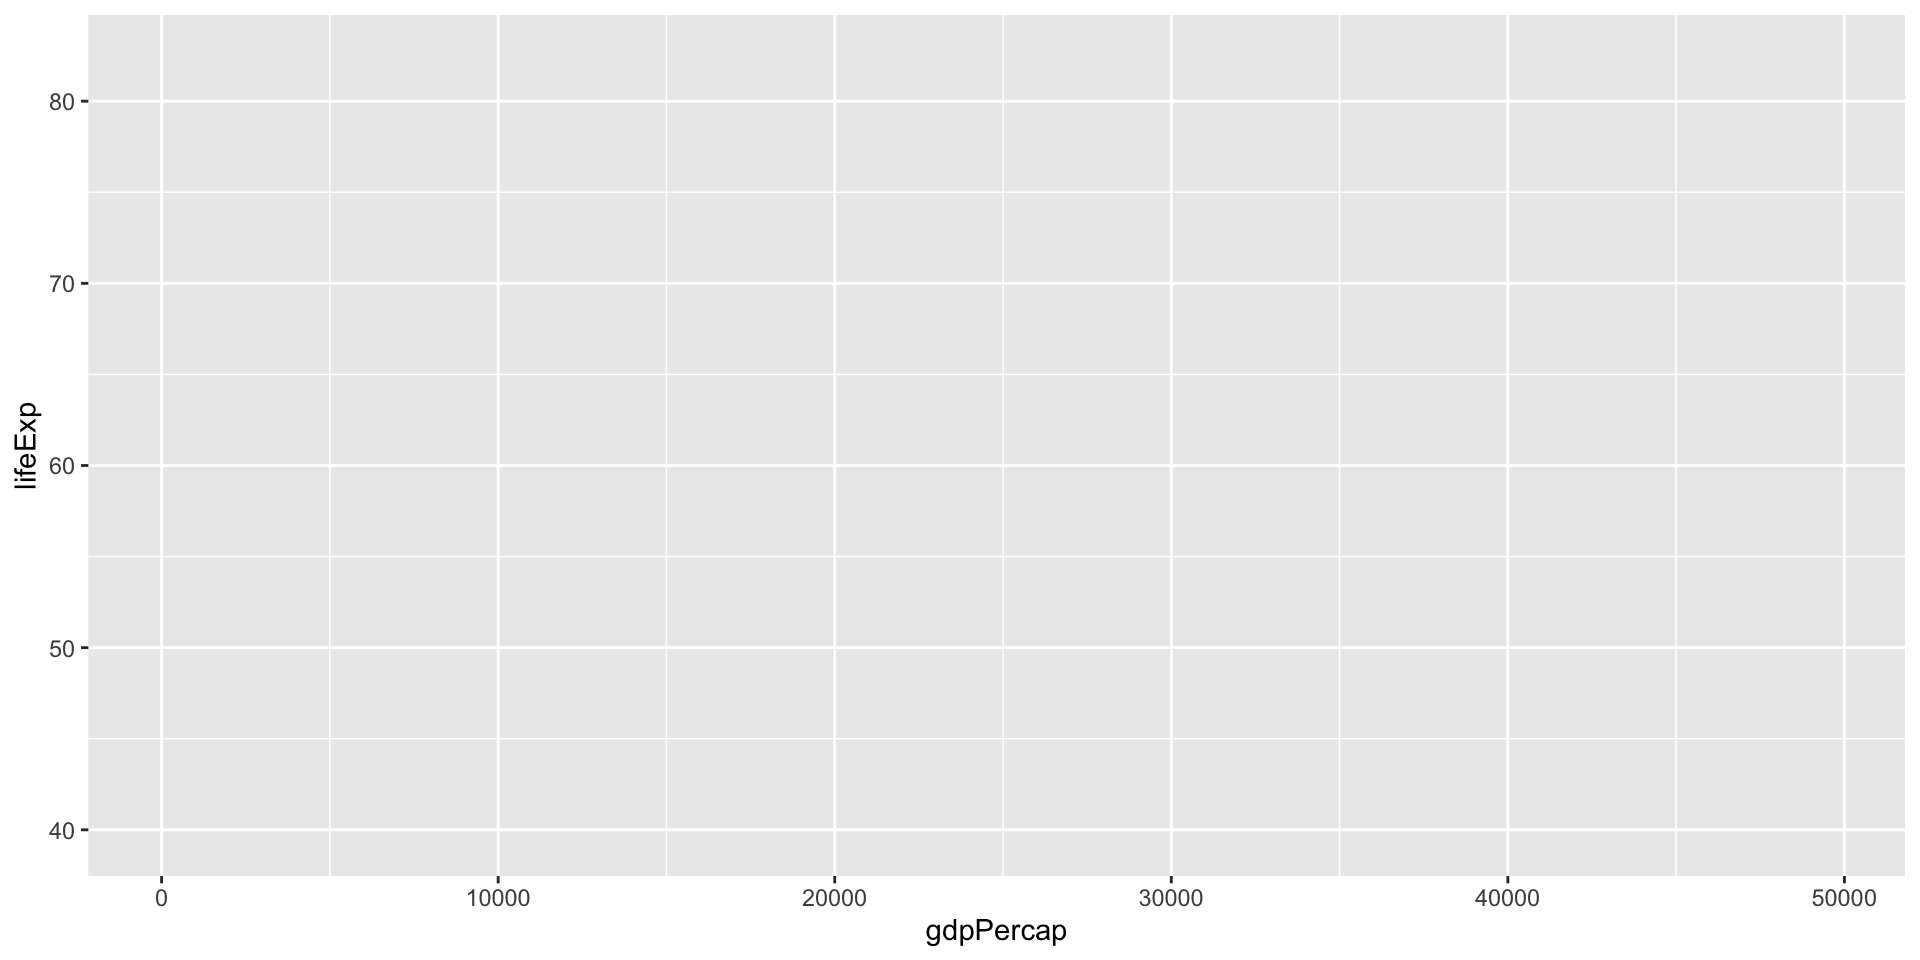
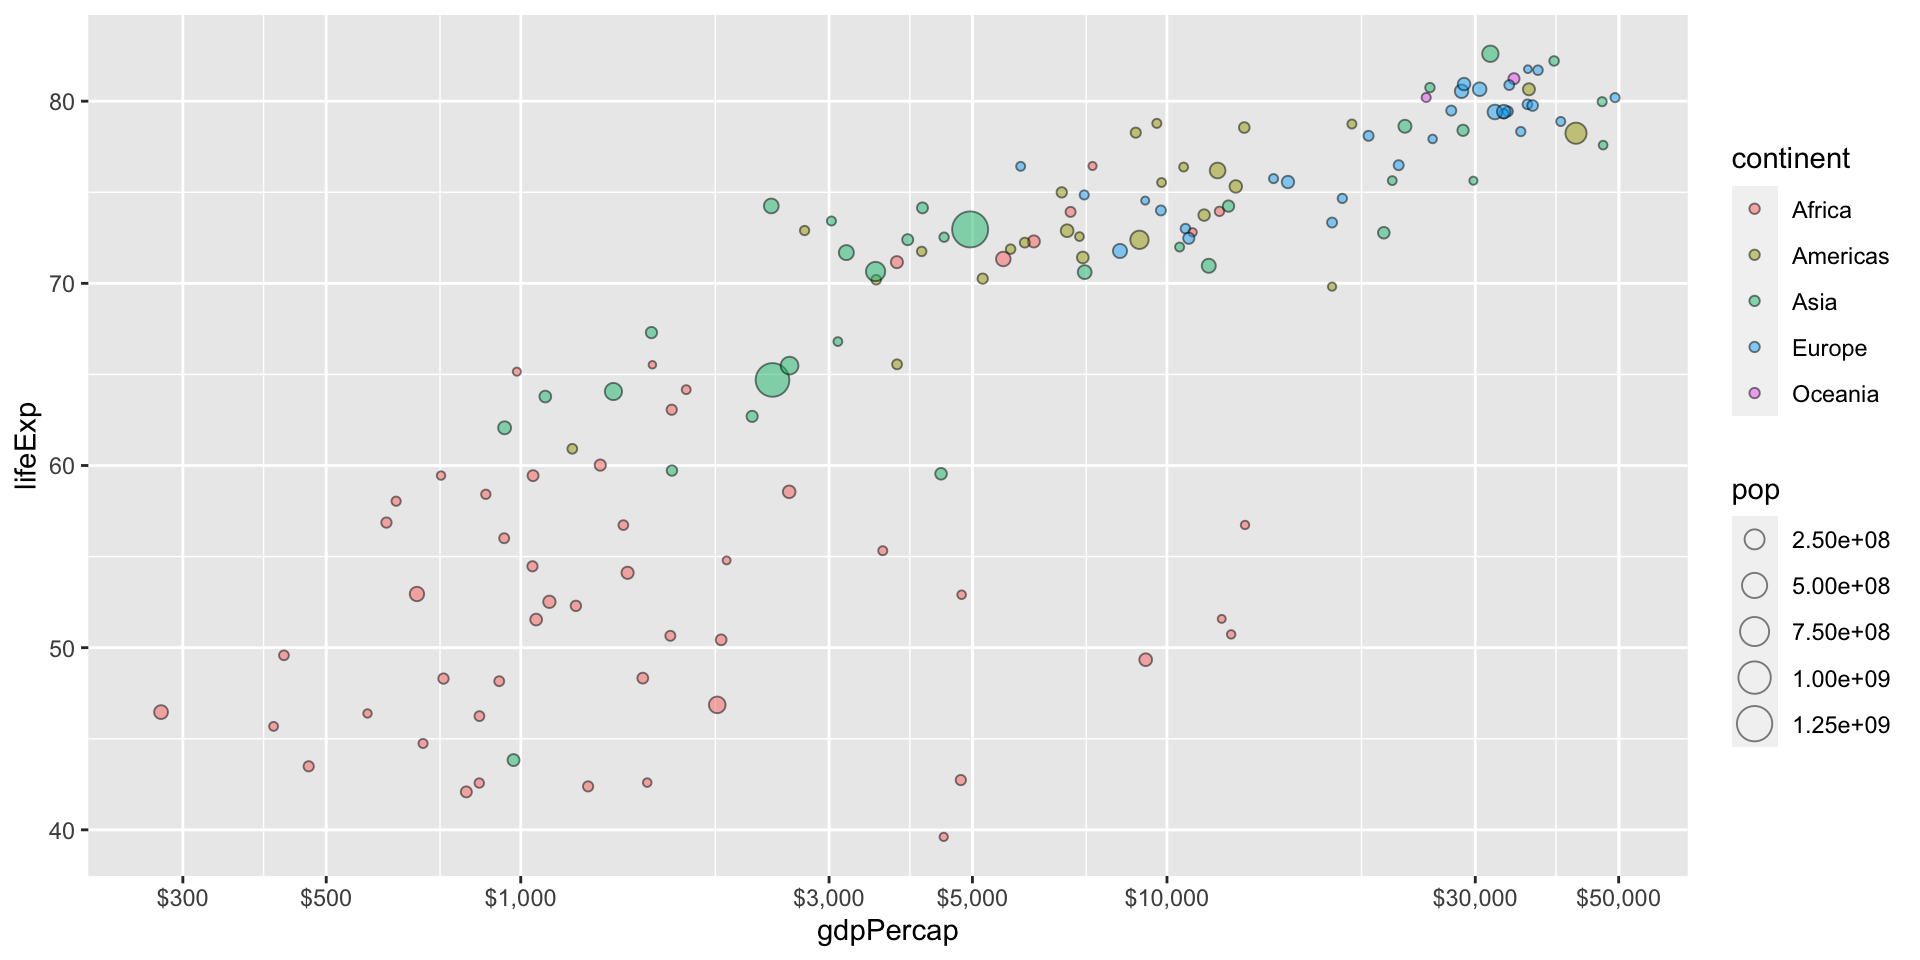
1 Start with the dataframe

1.1 Map X & Y axis
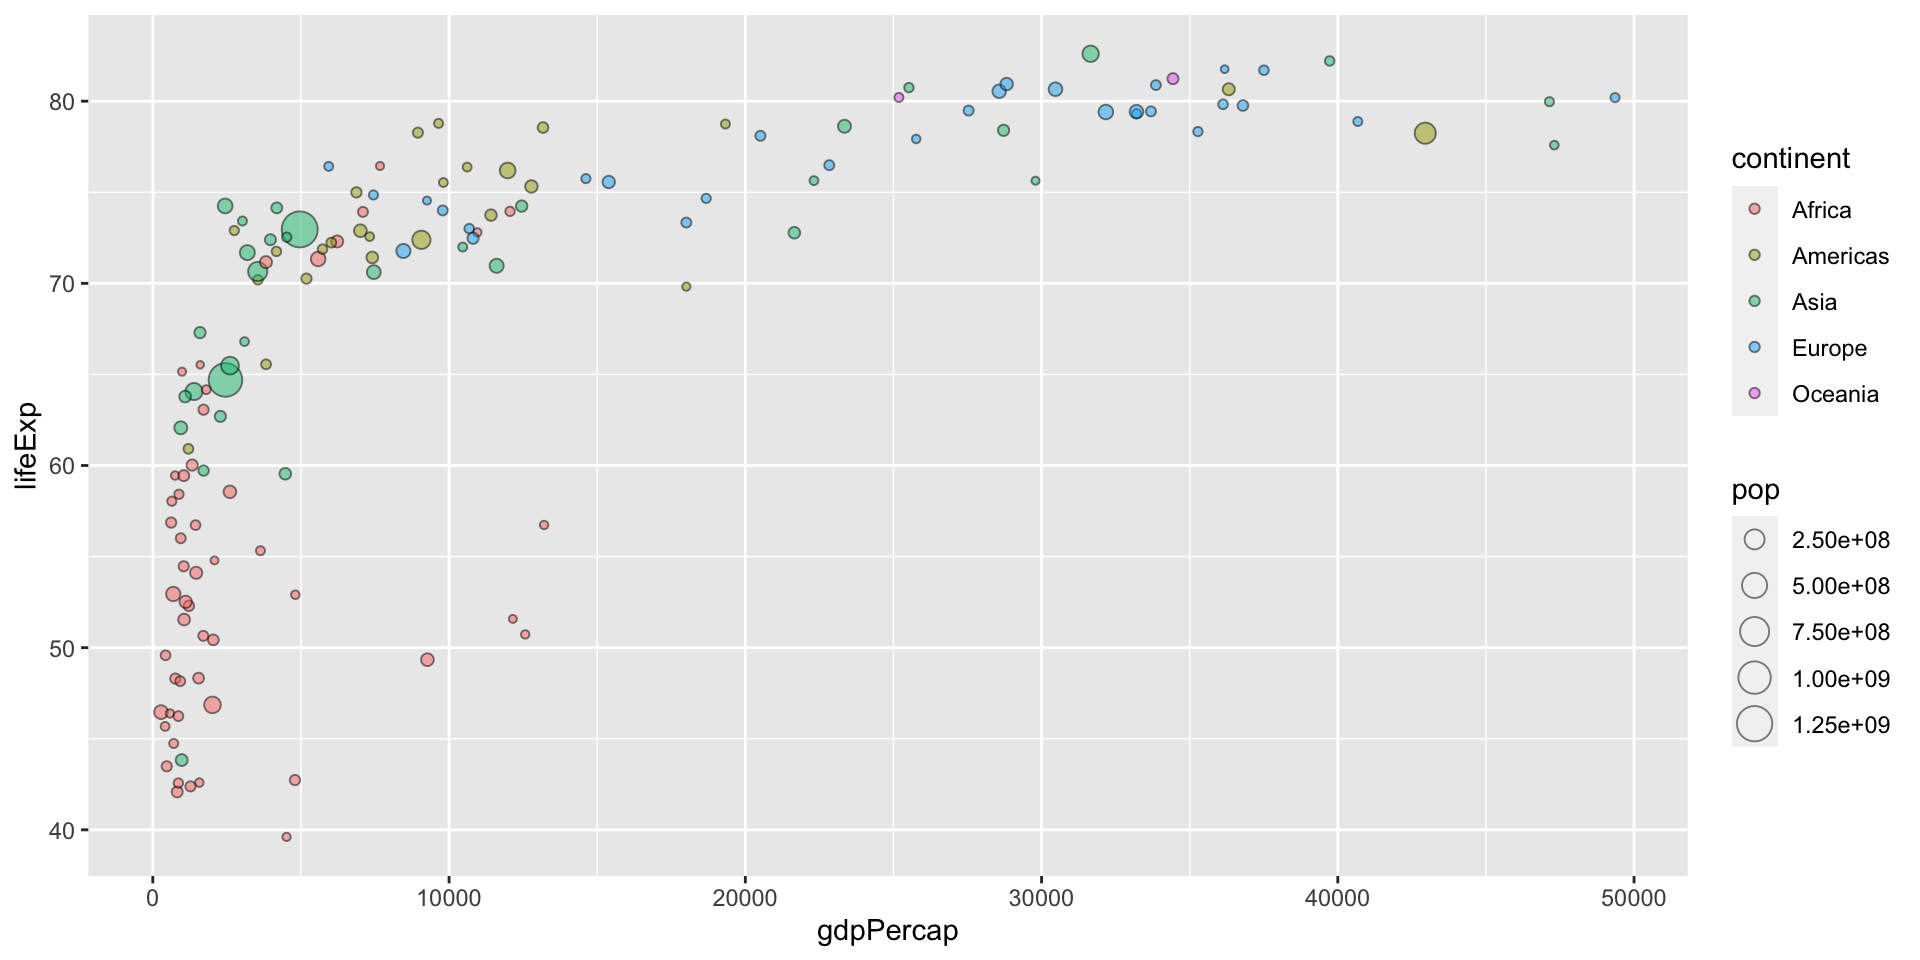
1.2 Represent each observation with a point
1.3 Transform the co-ordinates
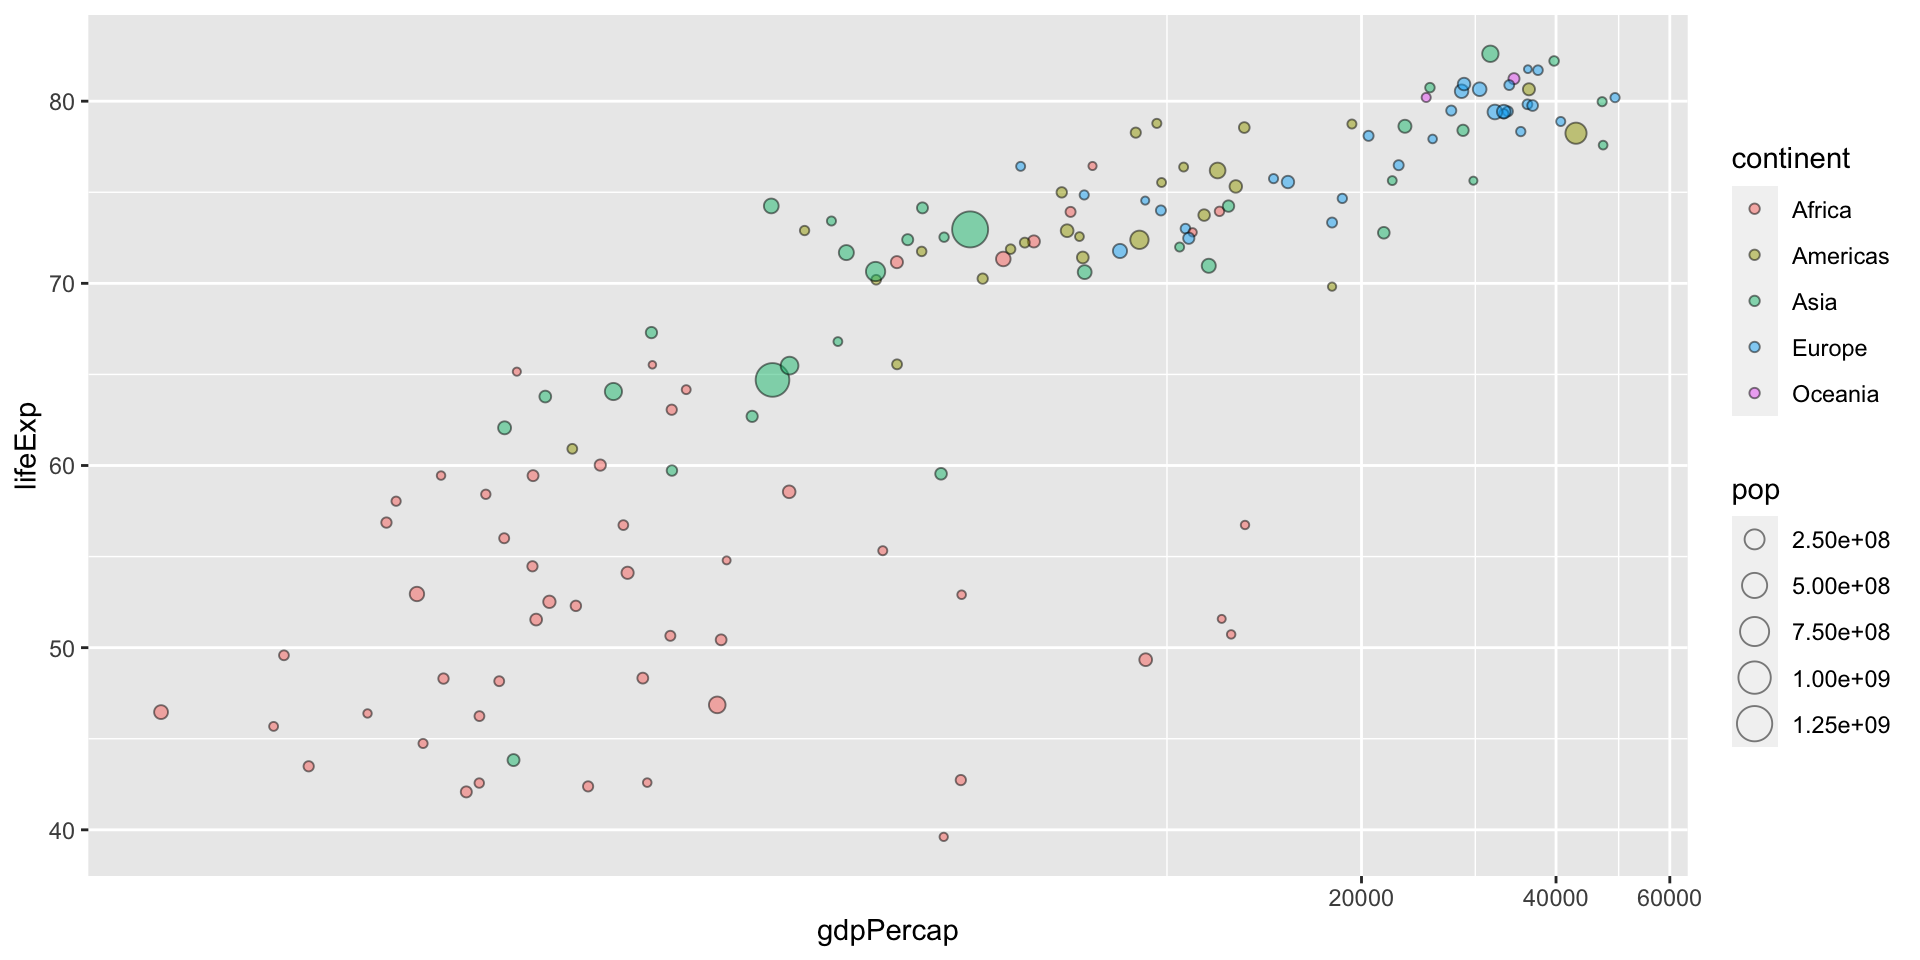
1.4 Scale the x axis
Add dollar sign
specify the log breaks
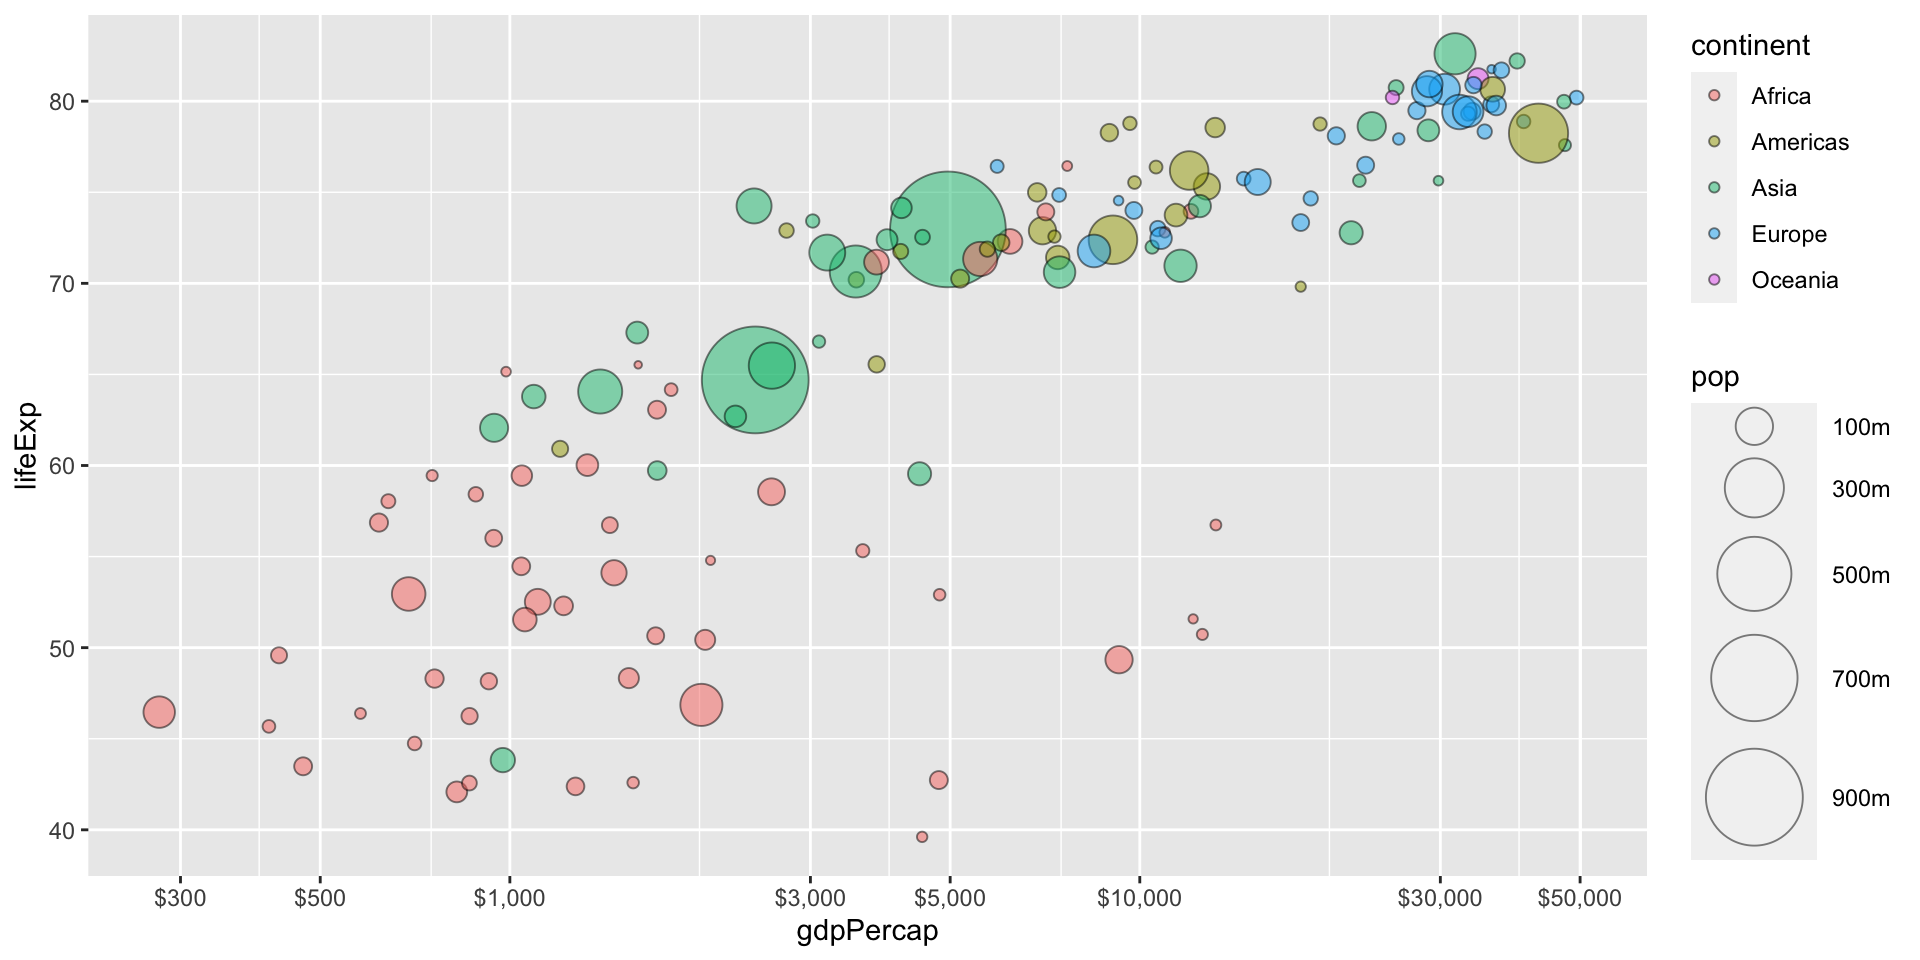
1.5 Specify the breaks and ranges
1.6 Add labels
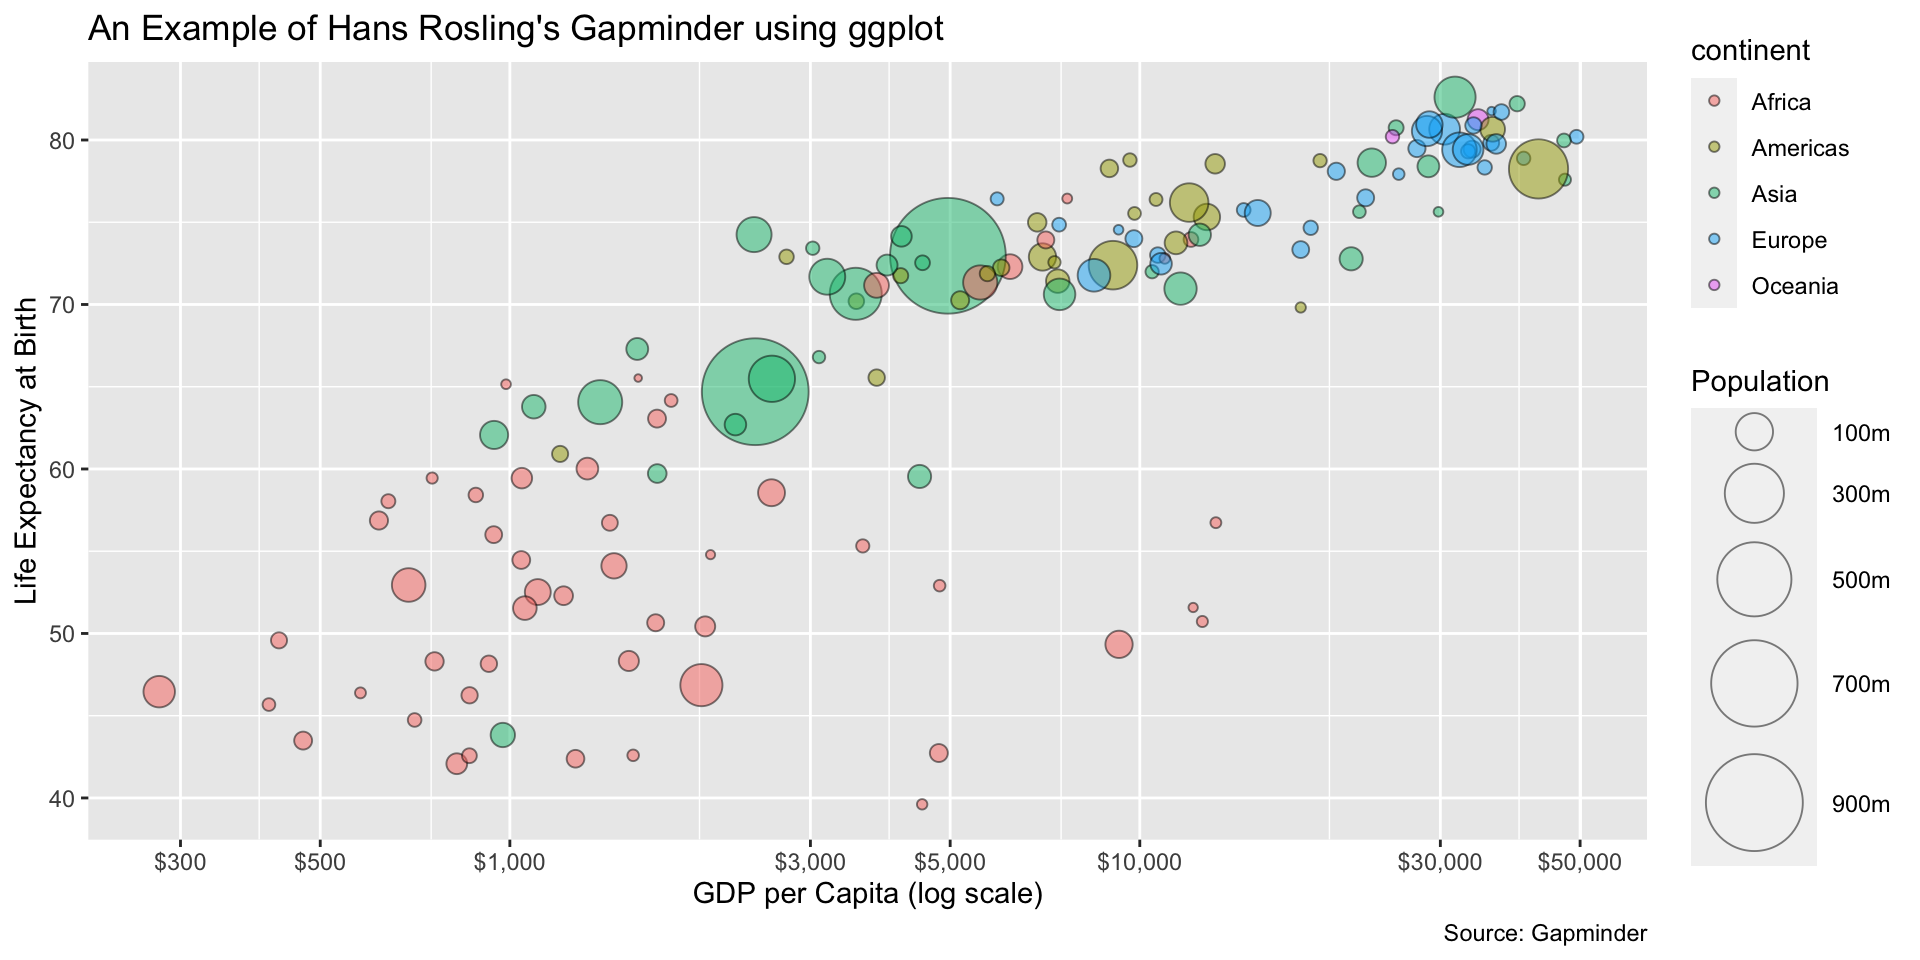
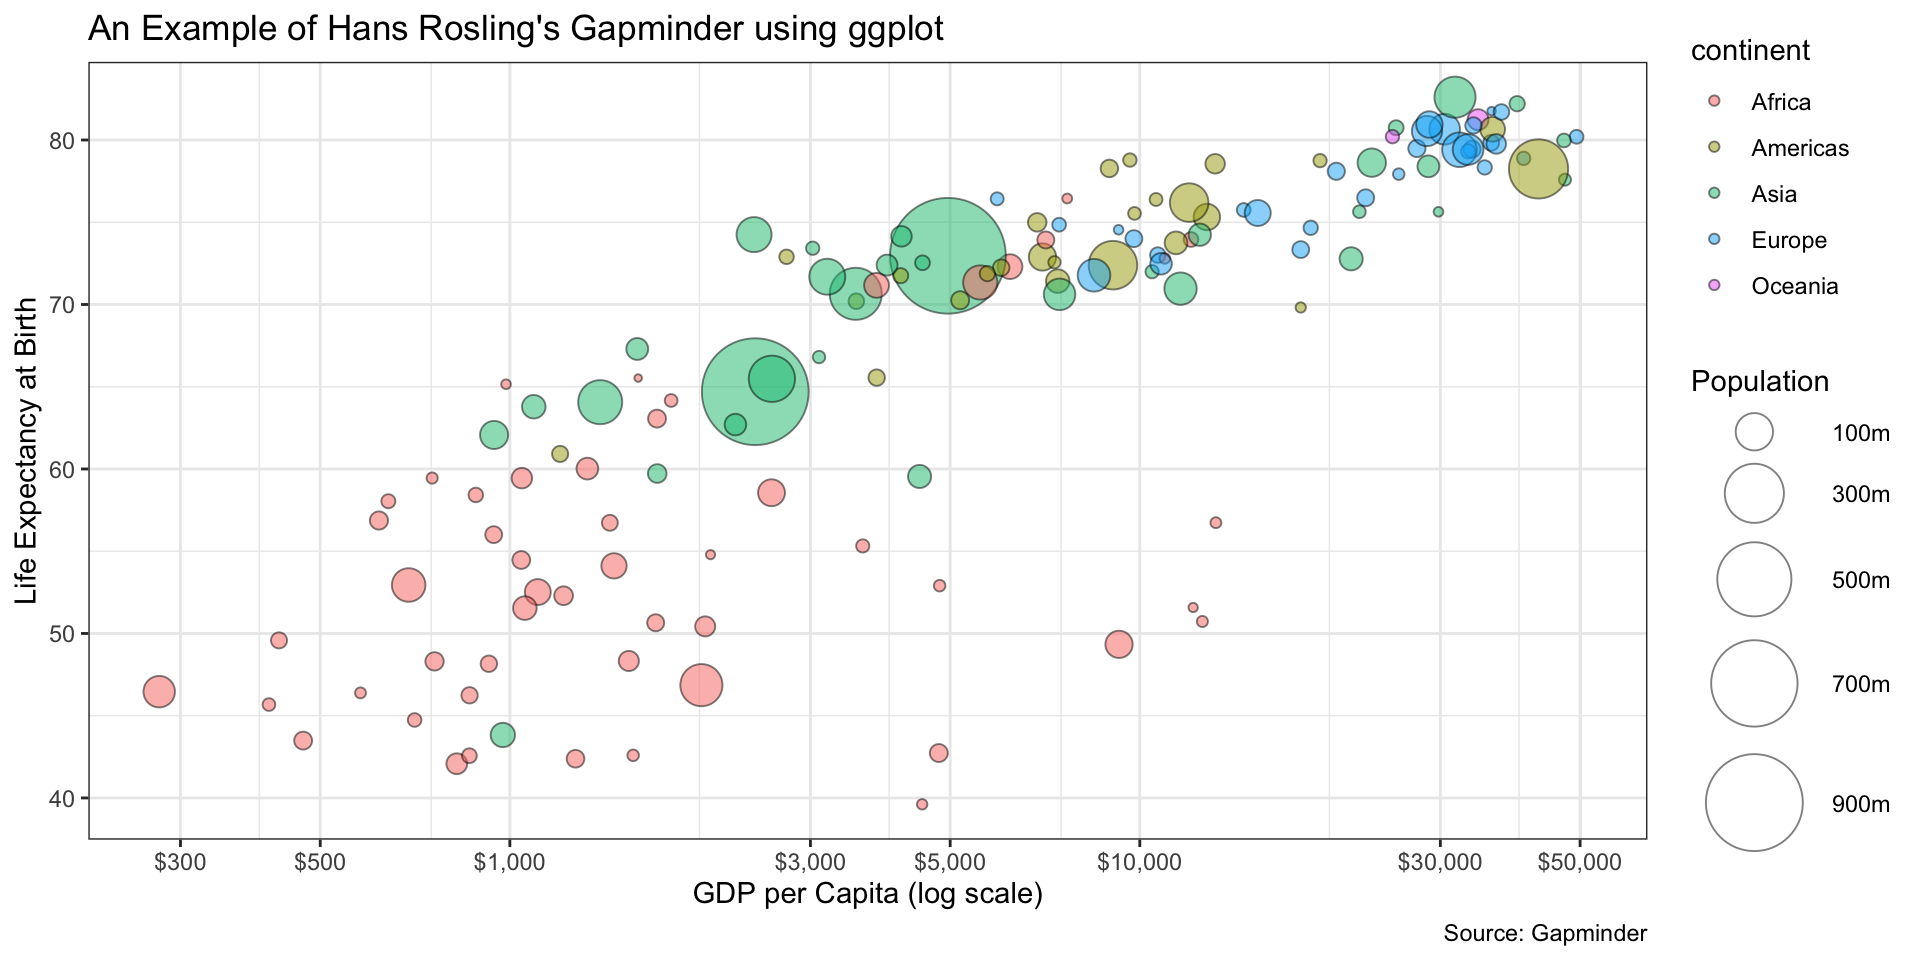
1.7 Add a theme
1.8 Annotate
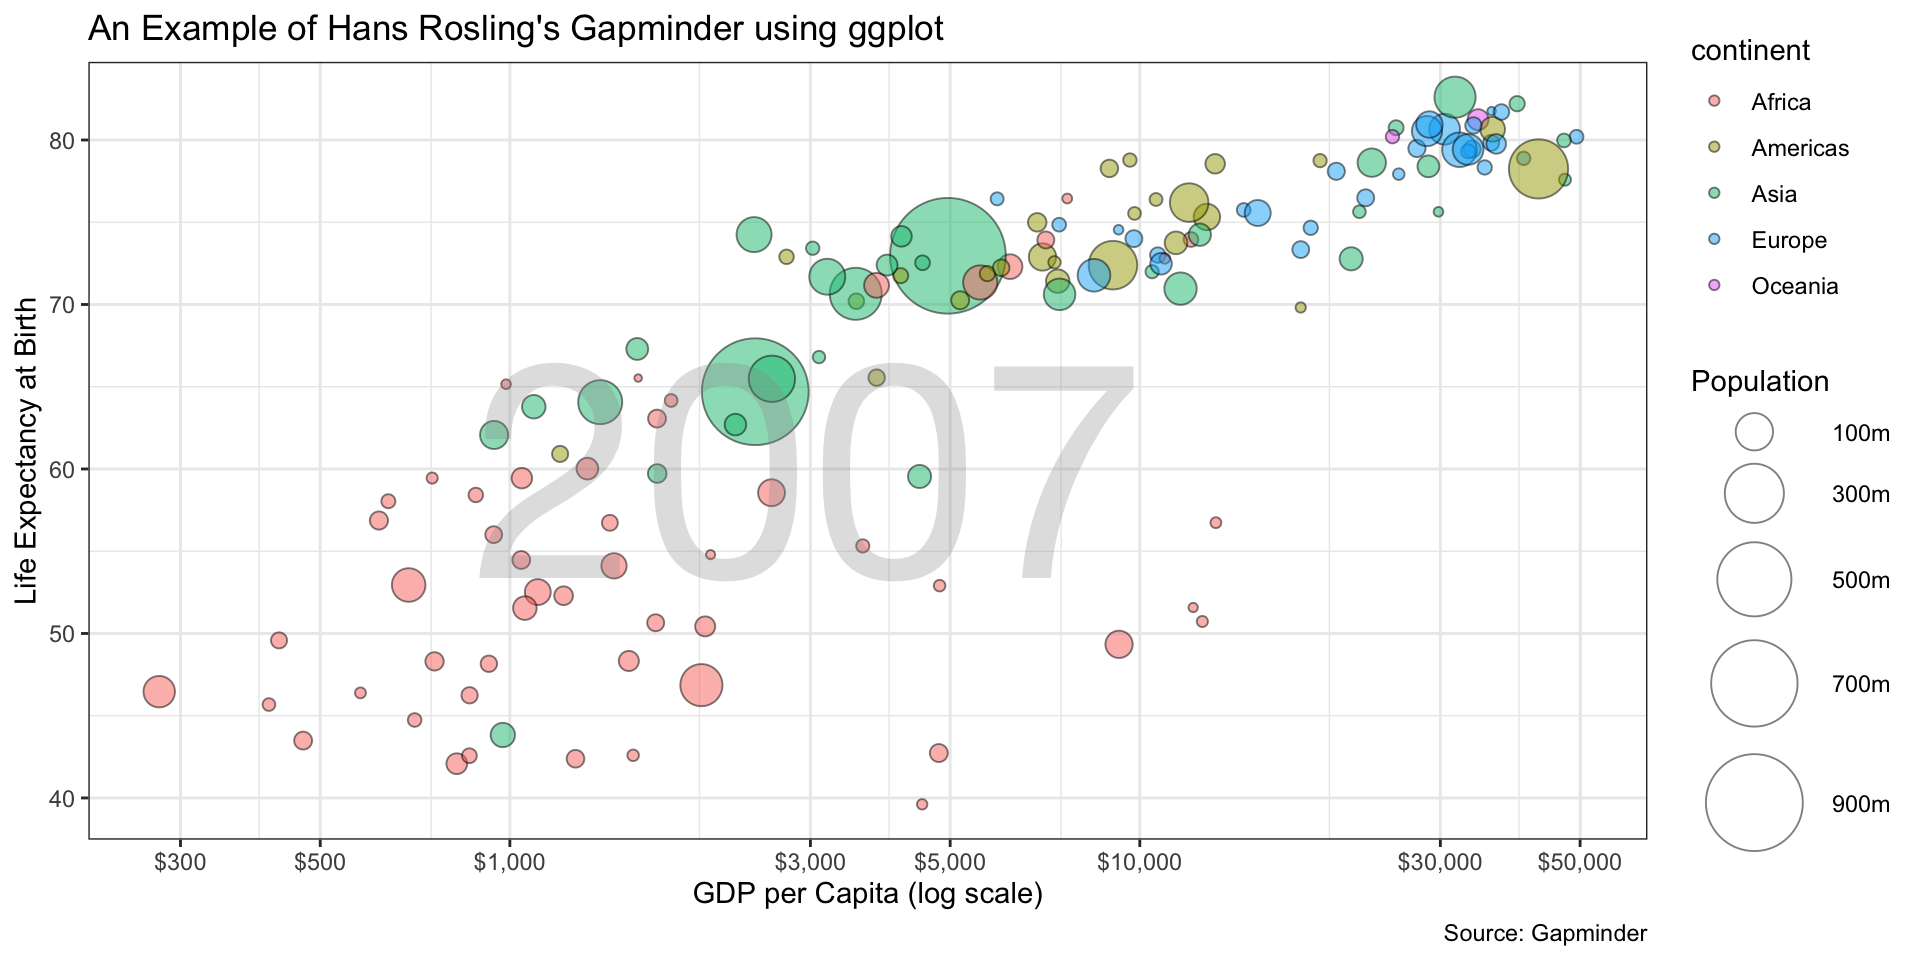
Final output
